
Machine Learning Algorithms Cheat Sheet
Machine learning is a subfield of artificial intelligence (AI) and computer science that focuses on using data and algorithms to mimic the way people learn, progressively improving its accuracy. This way, Machine Learning is one of the most interesting methods in Computer Science these days, and it's being applied behind the scenes in products and services we consume in everyday life.
In case you want to know what Machine Learning algorithms are used in different applications, or if you are a developer and you’re looking for a method to use for a problem you are trying to solve, keep reading below and use these steps as a guide.
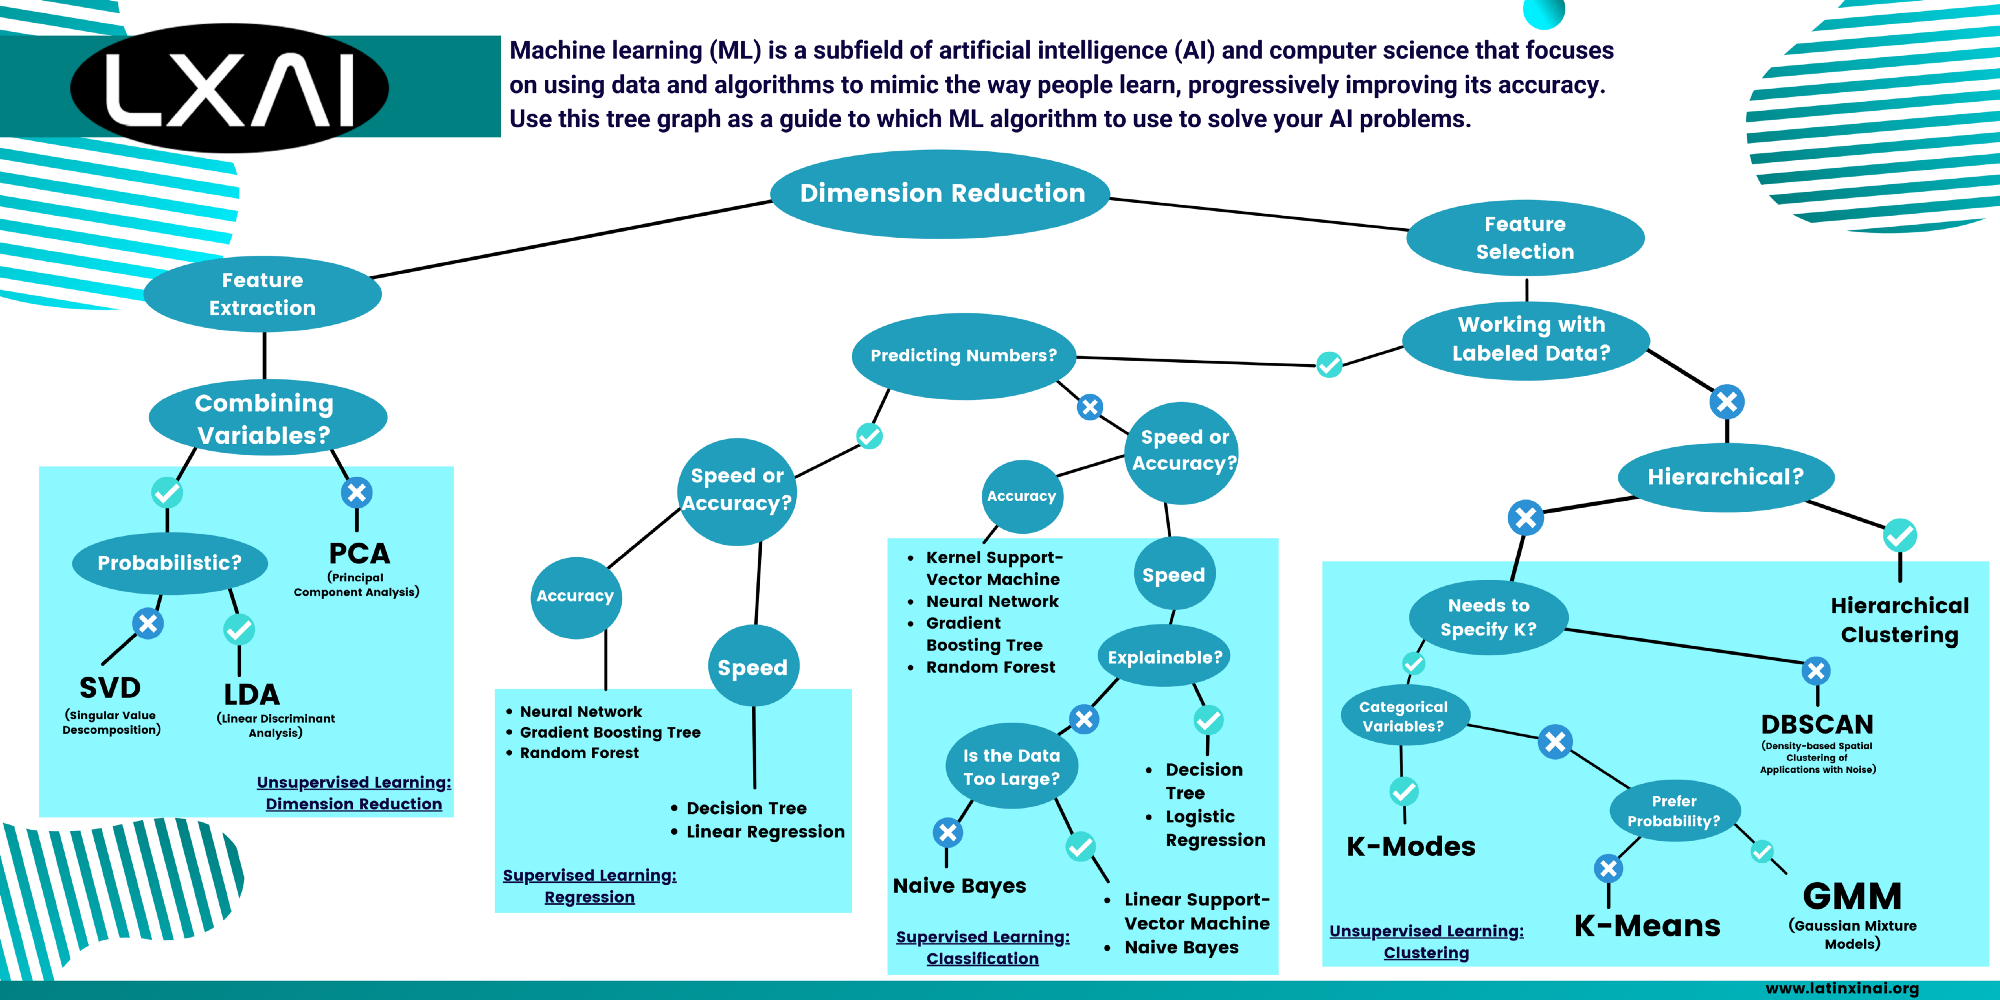
Machine Learning Algorithms Cheat Sheet by LatinX in AI™. Download the pdf: https://github.com/latinxinai/AI-Educational-Resources/raw/master/CheatSheets/Machine%20Learning%20Cheat%20Sheet.pdf
Machine Learning can be divided into three different types of learning: Unsupervised Learning, Supervised Learning, and Semi-supervised Learning.
Unsupervised learning uses information data that is not labeled, that way the machine should work with no guidance according to patterns, similarities, and differences.
On the other hand, supervised learning has a presence of a “teacher”, who is in charge of training the machine by labeling the data to work with. Next, the machine receives some examples that allow it to produce a correct outcome.
But there’s a hybrid approach for these types of learning, this Semi-supervised learning works with both labeled and unlabeled data. This method uses a tiny data set of labeled data to train and label the rest of the data with corresponding predictions, finally giving a solution to the problem.
To begin, you need to know the number of dimensions you’re working with, it means the number of inputs in your problem (also known as features). If you’re working with a large dataset or many features, you can opt for a Dimension Reduction algorithm.
Unsupervised Learning: Dimension Reduction
A large number of dimensions in a data collection can have a significant influence on machine learning algorithms' performance. The "curse of dimensionality" is a term used to describe the troubles large dimensionality might cause, for example, the “Distance Concentration” problem in Clustering, where the different data points will have the same value as the dimensionality of the data increases.
Techniques for minimizing the number of input variables in training data are referred to as “Dimension Reduction”.
Now you need to be familiar with the concept of Feature Extraction and Feature Selection to keep going. The process of translating raw data into numerical features that can be processed while keeping the information in the original data set is known as feature extraction. It produces better outcomes than applying machine learning to raw data directly.
It’s used for three known algorithms for dimensionality reduction including Principal Component Analysis, Singular Value Decomposition, and Linear Discriminant Analysis, but you need to know exactly which tool you want to use to find patterns or infer new information from the data.
If you’re not looking to combine the variables of your data, instead you want to remove unneeded features by just keeping the important ones, then you can use the Principal Component Analysis algorithm.
PCA (Principal Component Analysis)
It's a mathematical algorithm for reducing the dimension of data sets to simplify the number of variables while retaining most of the information. This trade-off of accuracy for simplicity is extensively used to find patterns in large data sets.

In terms of linear connections, it has a wide range of applications when large amounts of data are present, such as media editing, statistical quality control, portfolio analysis, and in many applications such as face recognition and image compression.
Alternatively, if you want an algorithm that works by combining variables of the data you’re working with, a simple PCA may not be the best tool for you to use. Next, you can have a probabilistic model or a non-probabilistic one. Probabilistic data is data that involves a random selection and is preferred by most scientists for more accurate results. While non-probabilistic data doesn’t involve that randomness.
If you are working with non-probabilistic data, you should use the Singular Value Decomposition algorithm.
SVD (Singular Value Decomposition)
In the realm of machine learning, SVD allows data to be transformed into a space where categories can be easily distinguished. This algorithm decomposes a matrix into three different matrices. In image processing, for example, a reduced number of vectors are used to rebuild a picture that is quite close to the original.

Compression of an image with a given number of components. Source: Singular Value Decomposition | SVD in Python (analyticsvidhya.com)
Compared with the PCA algorithm, both can make a dimension reduction of the data. But while PCA skips the less significant components, the SVD just turns them into special data, represented as three different matrices, that are easier to manipulate and analyze.
When it comes to probabilistic approaches, it’s better to use the Linear Discriminant Analysis algorithm for more abstract problems.
LDA (Linear Discriminant Analysis)
Linear Discriminant Analysis (LDA) is a classification approach in which two or more groups have previously been identified, and fresh observations are categorized into one of them based on their features. It’s different from PCA since LDA discovers a feature subspace that optimizes group separability while the PCA ignores the class label and focuses on capturing the dataset's highest variance direction.
This algorithm uses Bayes’ Theorem, a probabilistic theorem used to determine the likelihood of an occurrence based on its relationship to another event. It is frequently used in face recognition, customer identification, and medical fields to identify the patient’s disease status.

Distribution of 170 face images of five subjects (classes) randomly selected from the UMIST database in (a) PCA-based subspace, (b) D-LDA-based subspace, and (c) DF-LDA-based subspace. Source: (PDF) Face recognition using LDA-based algorithms (researchgate.net)
The next step is to select whether or not you want your algorithm to have responses, which means if you want to develop a predictive model based on labeled data to teach your machine. You may use the Clustering techniques if you’d rather use non-labeled data so your machine can work with no guidance and search for similarities.
On the other hand, the process of picking a subset of relevant features (variables, predictors) for use in model creation is known as feature selection. It helps in the simplicity of models to make them easier to comprehend for researchers and users, as well as the reduction of training periods and the avoidance of the dimensionality curse.
It includes the Clustering, Regression, and Classification methods.
Unsupervised Learning: Clustering
Clustering is a technique for separating groups with similar characteristics and assigning them to clusters. If you're looking for a hierarchical algorithm:
Hierarchical Clustering
This type of clustering is one of the most popular techniques in Machine Learning. Hierarchical Clustering assists an organization to classify data to identify similarities, and different groupings and features, so their pricing, goods, services, marketing messages, and other aspects of the business are targeted. Its hierarchy should show the data similar to a tree data structure, known as a Dendrogram. There are two ways of grouping the data: agglomerative and divisive.
Agglomerative clustering is a "bottom-up" approach. To put it another way, each item is first thought of as a single-element cluster (leaf). The two clusters that are the most comparable are joined into a new larger cluster at each phase of the method (nodes). This method is repeated until all points belong to a single large cluster (root).
Divisive clustering works in a “top-down” way. It starts at the root, where all items are grouped in a single cluster, then separates the most diverse into two at each iteration phase. Iterate the procedure until all of the items are in their group.
In case you’re not looking for a hierarchical solution, you must determine whether your method requires you to specify the number of clusters to be used. You can utilize the Density-based Spatial Clustering of Applications with Noise algorithm if you don't need to define it.
DBSCAN (Density-based Spatial Clustering of Applications with Noise)
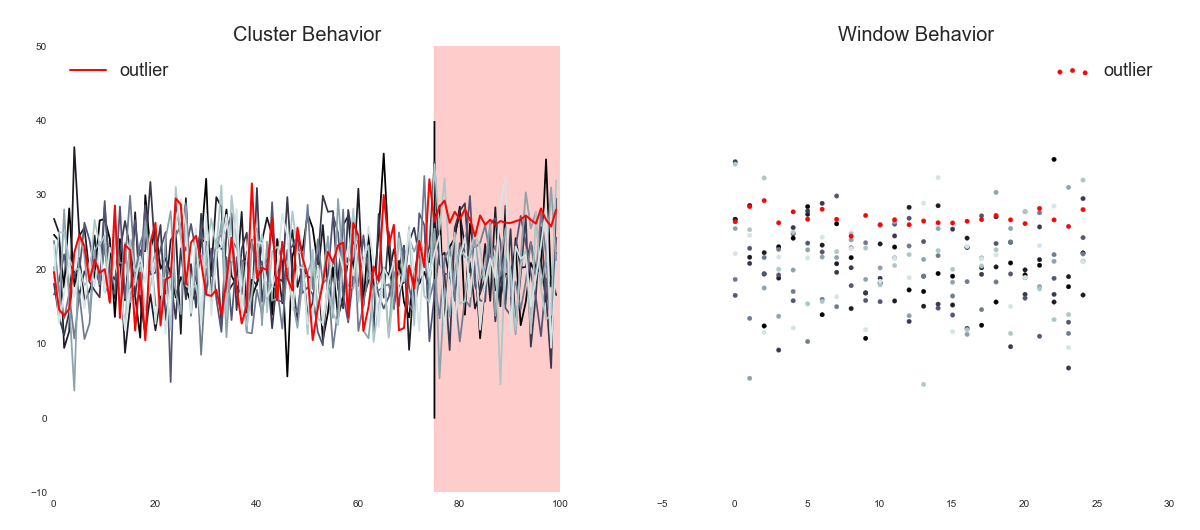
When it comes to arbitrary-shaped clusters or detecting outliers, it’s better to use Density-Based Clustering. DBSCAN is a method for detecting those arbitrary-shaped clusters and the ones with noise by grouping points close to each other based on two parameters: eps and minPoints.
The eps tells us the distance that needs to be between two points to be considered a cluster. While the minPoints are the minimum number of points to create a cluster. We use this algorithm in the analysis of Netflix Servers outliers. The streaming service runs thousands of servers, and normally less than one percent it’s capable of becoming unhealthy, which degrades the performance of the streaming. The real problem is that this problem isn’t easily visible, to solve it, Netflix uses DBSCAN specifying a metric to be monitored, then collects data and finally is passed to the algorithm for detecting the servers outliers.
One daily usage can be when e-commerce makes a product recommendation to its customers. Applying DBSCAN on the data of products the user has bought before.
In case you need to specify the number of clusters, there are three existing algorithms you could use, including K-Modes, K-Means, and Gaussian Mixture Model. Next, you need to know if you’re going to work with categorical variables, which are discrete variables that capture qualitative consequences by grouping observations (or levels). If you’re going to use them, you may opt for K-Modes.
K-Modes
This approach is used to group categorical variables. We determine the total mismatches between these types of data points. The fewer the differences between our data points, the more similar they are. The main difference between K-Modes and K-Means is that for categorical data points we can’t calculate the distance since they aren’t numeric values.
This algorithm is used for text mining applications, document clustering, topic modeling (where each cluster group represents a specific subject), fraud detection systems, and marketing.
For numeric data, you should use K-Means clustering.
K-Means
Data is clustered into a k number of groups in such a manner that data points in the same cluster are related while data points in other clusters are further apart. This distance is frequently measured with the Euclidean distance. In other words, the K-Means algorithm tries to minimize distances within a cluster and maximize the distance between different clusters.
Search engines, consumer segmentation, spam/ham detection systems, academic performance, defects diagnosis systems, wireless communications, and many other industries use k-means clustering.
If the intended result is based on probability, then the Gaussian Mixture Model should be used.
GMM (Gaussian Mixture Model)
This approach implies the presence of many Gaussian distributions, each of which represents a cluster. The algorithm will determine the probability of each data point belonging to each of the distributions for a given batch of data.
GMM differs from K-means since in GMM we don’t know if a data point belongs to a specified cluster, we use probability to express this uncertainty. While the K-means method is certain about the location of a data point and starts to iterate over the whole data set. The Gaussian Mixture Model is frequently used in signal processing, language recognition, anomaly detection, and genre classification of music.
In the event that you use labeled data to train your machine, first, you need to specify if it is going to predict numbers, this numerical prediction will help the algorithm to solve the problem. In case it does, you can choose Regression Algorithms.
Supervised Learning: Regression
Regression is a machine learning algorithm in which the outcome is predicted as a continuous numerical value. This method is commonly used in banking, investment, and other fields.
Here, you need to decide whether you rather have speed or accuracy. In case you’re looking for speed, you can use a Decision Tree algorithm or a Linear Regression algorithm.
Decision Tree
A decision tree is a flowchart like a tree data structure. Here, the data is continuously split according to a given parameter. Each parameter is allowed in a tree node, while the outcomes of the whole tree are located in the leaves. There are two types of decision trees:
Classification trees (Yes/No types), here the decision variable is categorical.
Regression trees (Continuous data types), where the decision or the outcome variable is continuous.
When there are intricate interactions between the features and the output variables, decision trees come in handy. When there are missing features, a mix of category and numerical features, or a large variance in the size of features, they perform better in comparison to other methods.
This algorithm is used to enhance the accuracy of promotional campaigns, detection of fraud, and detection of serious or preventable diseases on patients.
Linear Regression
Based on a given independent variable, this method predicts the value of a dependent variable. As a result, this regression approach determines if there is a linear connection between the input (independent variable) and the output (dependent variable). Hence, the term Linear Regression was coined.
Linear regression is ideal for datasets in which the features and the output variable have a linear relationship. It's usually used for forecasting (which is particularly useful for small firms to understand the sales effect), understanding the link between advertising expenditure and revenue, and in the medical profession to understand the correlations between medicine dose and patient blood pressure.
Alternatively, if you need accuracy for your algorithm you can use the following three algorithms: Neural Network, Gradient Boosting Tree, and Random Forest.
Neural Network
A Neural Network is required to learn the intricate non-linear relationship between the features and the target. It’s an algorithm that simulates the workings of neurons in the human brain. There are several types of Neural Networks, including the Vanilla Neural Network (that handles structured data only), as well as Recurrent Neural Network and Convolutional Neural Network which both can work with unstructured data.
When you have a lot of data (and processing capacity), and accuracy is important to you, you'll almost certainly utilize a neural network. This algorithm has many applications, such as paraphrase detection, text classification, semantic parsing, and question answering.
Gradient Boosting Tree
Gradient Boosting Tree is a method for merging the outputs of separate trees to do regression or classification. Both supervised learning incorporates a large number of decision trees to lessen the danger of overfitting (a statistical modeling mistake that happens when a function is too tightly matched to a small number of data points, making it possible to reduce the predictive power of the model) that each tree confronts alone. This algorithm employs Boosting, which entails consecutively combining weak learners (typically decision trees with just one split, known as decision stumps) so that each new tree corrects the preceding one's faults.
When we wish to reduce the Bias error, which is the amount whereby a model's prediction varies from the target value, we usually employ the Gradient Boosting Algorithm. When there are fewer dimensions in the data, a basic linear model performs poorly, interpretability is not critical, and there is no stringent latency limit, gradient boosting is most beneficial.
It’s used in many studies, such as a gender prediction algorithm based on the motivation of masters athletes, using gradient boosted decision trees, exploring their capacity to predict gender based on psychological dimensions evaluating reasons to participate in masters sports as statistical methodologies.
Random Forest
Random Forest is a method for resolving regression and classification problems. It makes use of ensemble learning, which is a technique for solving complicated problems by combining several classifiers. It consists of many decision trees, where the outcomes of every one of them will throw the final result taking the average or mean decisions. The greater the number of trees, the better precision of the outcome.
Random Forest is appropriate when we have a huge dataset and interpretability is not a key problem, as it becomes increasingly difficult to grasp as the dataset grows larger. This algorithm is used in stock market analysis, diagnosis of patients in the medical field, to predict the creditworthiness of a loan applicant, and in fraud detection.
For non-numerical prediction algorithms, you can choose the Classification methods over regression.
Supervised Learning: Classification
Alike to the regression methods, you need to choose if you would rather speed or accuracy for your outcomes.
If you’re looking for accuracy, you not only may opt for the Kernel Support-Vector Machine, but you can use other algorithms that were mentioned previously, such as Neural Network, Gradient Boosting Tree, and Random Forest. Now, let’s introduce this new algorithm.
Kernel Support-Vector Machine
To bridge linearity and non-linearity, the kernel technique is commonly utilized in the Support-Vector Machine model. To understand this, it is essential to know that the SVM method learns how to separate different groups by forming decision boundaries.
But when we’re in front of a data set of higher dimensions and the costs are expensive, it is recommended to use this kernel method. It enables us to work in the original feature space without having to compute the data's coordinates in a higher-dimensional space.
It’s mostly used in text classification problems since most of them can be linearly separated.
When speed is needed, we need to see if the technique we're going to employ is explainable, which implies it can explain what happens in your model from start to finish. In that case, we might use a Decision Tree algorithm or a Logistic Regression.
Logistic Regression
Logistic Regression is used when the dependent variable is categorical. Through probability estimate, it aids in understanding the link between dependent variables and one or more independent variables.
There are three different types of Logistic Regression:
Binary Logistic Regression, where the response only has two possible values.
Multinomial Logistic Regression, three or more outcomes with no order.
Ordinal Logistic Regression, three or more categories with ordering.
The Logistic Regression algorithm is widely used in hotel booking, it shows you (through statistical research) the options you may want to have in your bookings, such as the hotel room, some journeys in the area, and more.
If you’re only interested in the input and output of your problem, you can check if the data you’re working with is too large. If the number is huge, you can use a Linear Support-Vector Machine.
Linear Support-Vector Machine
Linear SVM is used for linearly separable data. It works in data with different variables (linearly separable data) that can be separated with a simple straight line (linear SVM classifier). This straight line represents the user behavior or outcome through a stated problem.
Since texts are often linearly separable and have a lot of features, the Linear SVM is the best option to use in its classification. In the case of our next algorithm, you can use it either if the data is large or not.
Naïve Bayes
This algorithm is based on Bayes Theorem. It consists of predictions through objects’ probabilities. It’s called Naïve because it assumes that the appearance of one feature is unrelated to the appearance of other characteristics.
This method is well-liked because it can surpass even the most sophisticated classification approaches. Furthermore, it is simple to construct and may be built rapidly. Due to its easy use and efficiency, it’s used to make real-time decisions. Along with that, Gmail uses this algorithm to know if a mail is Spam or not.
The Gmail spam detection picks a set of words or ‘tokens’ to identify spam email (this method is also used in text classification and it’s commonly known as a bag of words). Next, they use those tokens and compare them to spam and non-spam emails. Finally, using the Naive Bayes algorithm, they calculate the probability that the email is spam or not.
In Conclusion
We find that Machine Learning is a widely utilized technology with many applications unrecognized by us because it's a regular occurrence. In this article, we have not only distinguished between the different approaches of machine learning but how to use them according to the data we’re working with and the problem we want to solve.
To learn Machine Learning, you have to have some knowledge of calculus, linear algebra, statistics, and programming skills. You can use different programming languages to implement one of these algorithms, from Python to C++, and R language. It’s up to you to make the best decision and start learning along with your machine.